Anatomy of a champion: Which NBA playoff teams fit the statistical profile?
What does a champion look like?
Anyone familiar with the pantheon of NBA champions knows that certain teams have dominated - 11 franchises won the last 39 titles - and that surprise contenders rarely creep up on us. But what do those champions have in common? Do they provide a statistical profile we can use to learn about this year's playoffs?
Let's find out.
If we're looking for statistical similarities among championship teams that will help us evaluate this year's postseason field, it makes sense to concentrate on the period of time most applicable to 2019. The NBA's current 30-team, six-division scheduling format has been in place since 2004-05. That works well because it still gives us a solid sample size of 14 seasons. The league had already adopted rules that prioritized offense by eliminating hand-checking and calling illegal defenses. And it's also recent enough to account for the modern importance of 3-point shooting.
Let's dig into the cold, hard statistics that link these NBA champions and see what those numbers say about this year's playoff teams.
(Note: Counting statistics for the lockout-shortened 2011-12 season have been prorated to 82 games)
Wins
| Year | Champion | Wins | League rank |
|---|---|---|---|
| 2005 | Spurs | 59 | 3rd |
| 2006 | Heat | 52 | 5th |
| 2007 | Spurs | 58 | 3rd |
| 2008 | Celtics | 66 | 1st |
| 2009 | Lakers | 65 | 2nd |
| 2010 | Lakers | 57 | 3rd |
| 2011 | Mavericks | 57 | 5th |
| 2012* | Heat | 57 | 4th |
| 2013 | Heat | 66 | 1st |
| 2014 | Spurs | 62 | 1st |
| 2015 | Warriors | 67 | 1st |
| 2016 | Cavaliers | 57 | 3rd |
| 2017 | Warriors | 67 | 1st |
| 2018 | Warriors | 58 | 3rd |
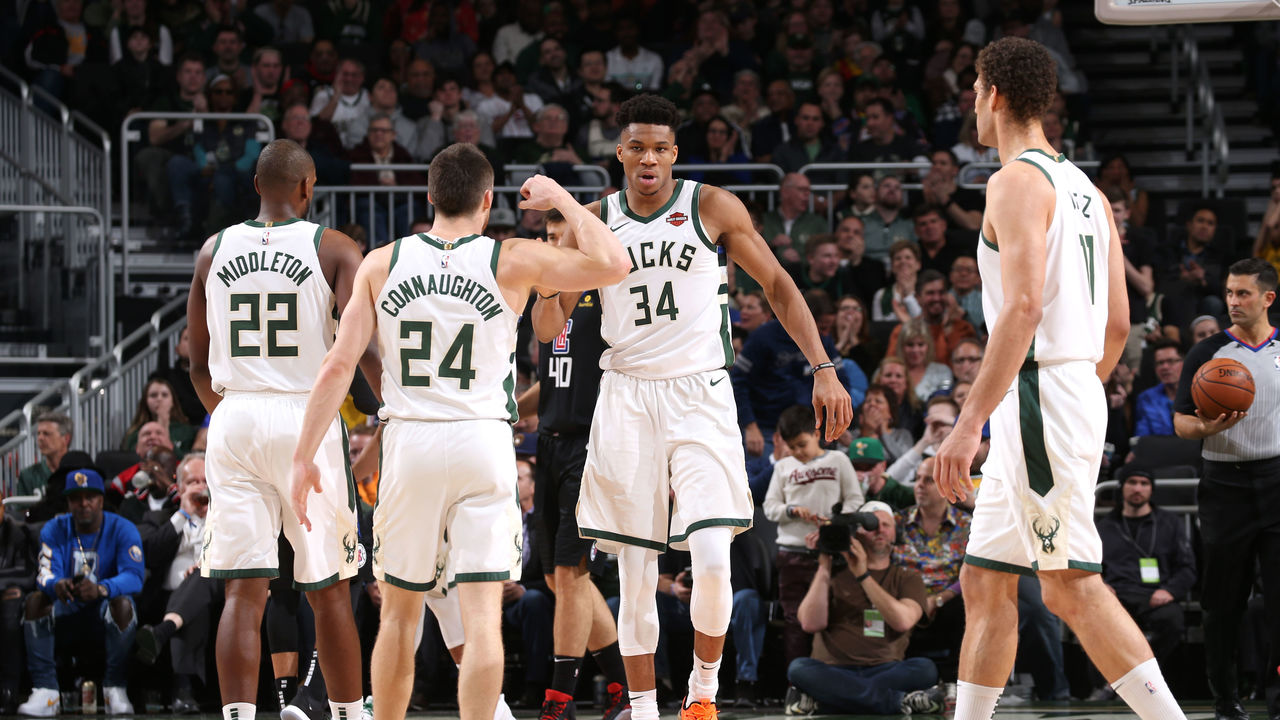
Without exception, modern champions have compiled a minimum of 52 wins and a top-five overall record during the regular season.
Even that might be a bit conservative, as the lone outlier on this list - the 2005-06 Heat - were on a 55-win pace (41-20) after Pat Riley took over coaching duties from Stan Van Gundy, and a 58-win clip (42-17) with Shaquille O'Neal in the lineup after the big man missed 18 of 20 games to start the season. You'll also notice that the last six champs finished with top-three records.
Who fits the bill? Bucks, Raptors, Warriors, Nuggets, Trail Blazers
Who doesn't measure up? Rockets, 76ers, Jazz, Celtics, Thunder, Pacers, Spurs, Clippers, Magic, Nets, Pistons
Potential outlier: Rockets
Houston finished in a tie for fifth overall with Portland, missing the championship cutoff thanks to the season-series tiebreaker with the Blazers. The Rockets are a lot better than their 53-win resume suggests, having gone 42-15 (a 60-win pace) after an 11-14 start.
Home vs. Road
| Year | Champion | Home wins | Road wins |
|---|---|---|---|
| 2005 | Spurs | 38 | 21 |
| 2006 | Heat | 31 | 21 |
| 2007 | Spurs | 31 | 27 |
| 2008 | Celtics | 35 | 31 |
| 2009 | Lakers | 36 | 29 |
| 2010 | Lakers | 34 | 23 |
| 2011 | Mavericks | 29 | 28 |
| 2012* | Heat | 35 | 22 |
| 2013 | Heat | 37 | 29 |
| 2014 | Spurs | 32 | 30 |
| 2015 | Warriors | 39 | 28 |
| 2016 | Cavaliers | 33 | 24 |
| 2017 | Warriors | 36 | 31 |
| 2018 | Warriors | 29 | 29 |
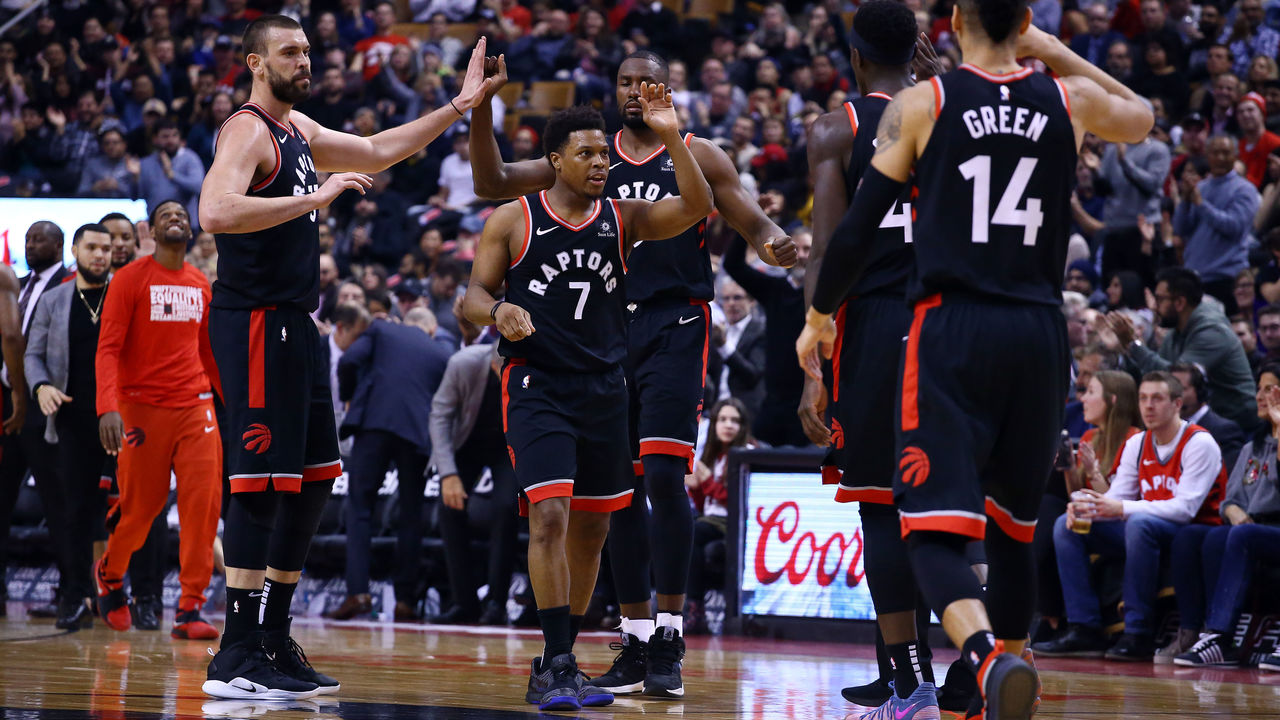
Every champion dominated at home and, at the very least, posted a winning record on the road. We're looking for teams that won a minimum of 29 home games and at least 21 games away from home.
Who fits the bill? Bucks, Raptors, Warriors, Rockets, Trail Blazers, Jazz
Who doesn't measure up? Nuggets, 76ers, Celtics, Thunder, Pacers, Spurs, Clippers, Magic, Nets, Pistons
Potential outlier: Nuggets
The Nuggets posted a league-best 34-7 home record and had a chance to clinch a winning road record Sunday in Portland - but they rested Nikola Jokic, Paul Millsap, and Jamal Murray in a loss that sunk them to 20-21 away from Pepsi Center.
Scoring differential
| Year | Champion | Differential | Rank | Net Rtg | Rank |
|---|---|---|---|---|---|
| 2005 | Spurs | +7.8 | 1st | +8.2 | 1st |
| 2006 | Heat | +3.9 | 5th | +4.1 | 6th |
| 2007 | Spurs | +8.4 | 1st | +9.2 | 1st |
| 2008 | Celtics | +10.3 | 1st | +10.8 | 1st |
| 2009 | Lakers | +7.7 | 2nd | +7.9 | 2nd |
| 2010 | Lakers | +4.7 | 6th | +4.9 | 5th |
| 2011 | Mavericks | +4.2 | 8th | +4.4 | 8th |
| 2012* | Heat | +6.0 | 4th | +6.4 | 3rd |
| 2013 | Heat | +7.9 | 2nd | +8.2 | 2nd |
| 2014 | Spurs | +7.7 | 1st | +8.2 | 1st |
| 2015 | Warriors | +10.1 | 1st | +10.0 | 1st |
| 2016 | Cavaliers | +6.0 | 4th | +6.3 | 4th |
| 2017 | Warriors | +11.6 | 1st | +11.3 | 1st |
| 2018 | Warriors | +6.0 | 3rd | +5.9 | 3rd |
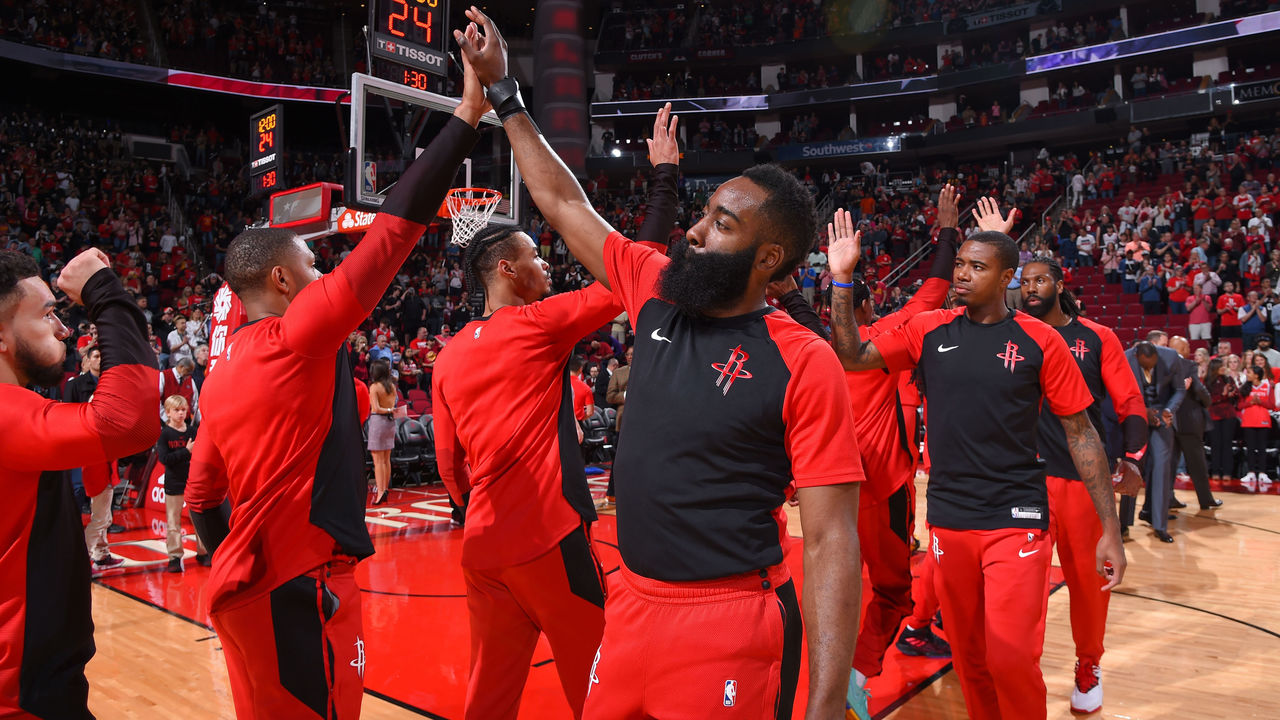
Our contemporary champion needs to boast a top-eight scoring differential and top-eight net rating per 100 possessions, outscoring opponents during the regular season by at least 3.9 points per 48 minutes or 4.1 points per 100 possessions.
Who fits the bill? Bucks, Warriors, Raptors, Jazz, Rockets, Celtics, Trail Blazers
Who doesn't measure up? Nuggets, 76ers, Thunder, Pacers, Spurs, Clippers, Magic, Nets, Pistons
Potential outlier: 76ers
Philly's 11th-ranked point differential (plus-2.7) and net rating (plus-2.6) leave a lot to be desired for a team with Finals aspirations, but consider this: Among the 47 most utilized lineups around the league since the trade deadline, none performed better than the Sixers' starting unit of Ben Simmons, JJ Redick, Jimmy Butler, Tobias Harris, and Joel Embiid. That combination outscored opponents by a whopping 17.6 points per 100 possessions.
Offense
| Year | Champion | Off. Rtg rank | eFG% rank |
|---|---|---|---|
| 2005 | Spurs | 8th | 6th |
| 2006 | Heat | 7th | 2nd |
| 2007 | Spurs | 5th | 2nd |
| 2008 | Celtics | 9th | 5th |
| 2009 | Lakers | 3rd | 6th |
| 2010 | Lakers | 11th | 15th |
| 2011 | Mavericks | 8th | 3rd |
| 2012* | Heat | 8th | 5th |
| 2013 | Heat | 2nd | 1st |
| 2014 | Spurs | 6th | 2nd |
| 2015 | Warriors | 2nd | 1st |
| 2016 | Cavaliers | 3rd | 4th |
| 2017 | Warriors | 1st | 1st |
| 2018 | Warriors | 3rd | 1st |
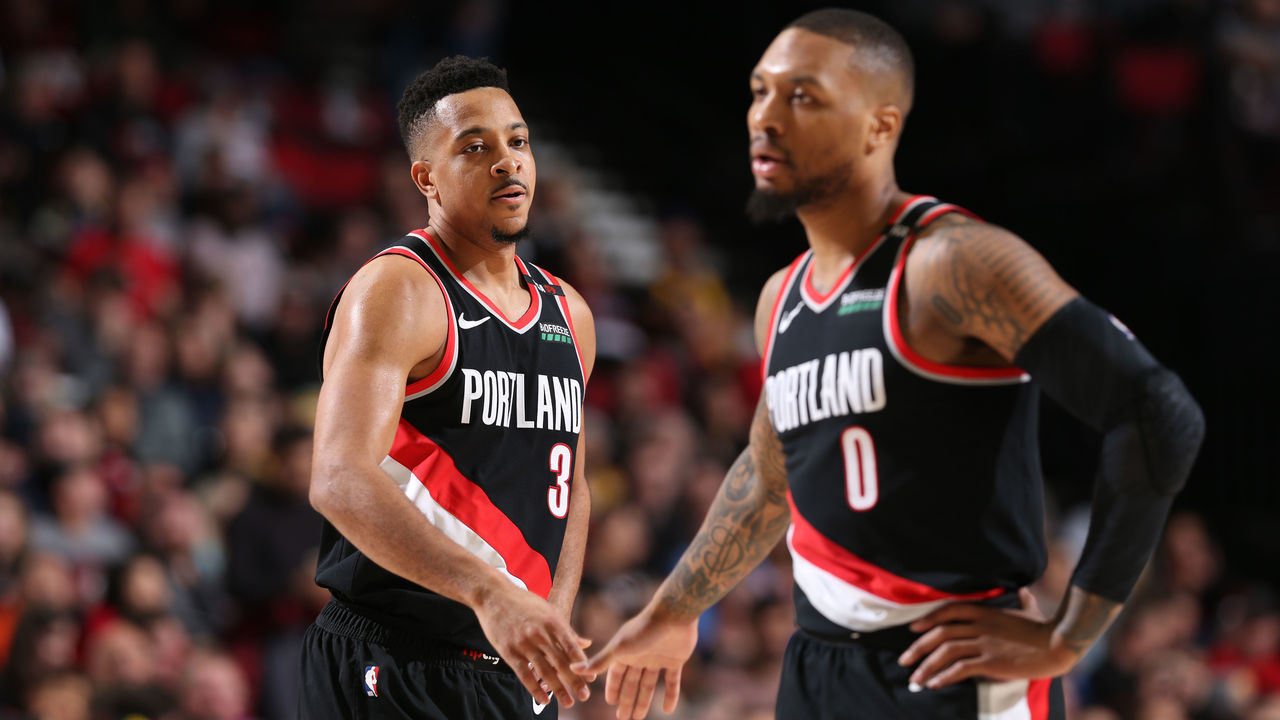
Eliminate the 2009-10 Lakers, and it looks like a top-nine offensive rating (points per 100 possessions) and a top-six effective field-goal percentage are requirements for a championship offense.
Dig deeper and you'll find that as NBA offenses have shifted to emphasize the 3-point shot, the last eight champions boasted a top-five effective field-goal percentage, and the last seven champions all finished in the top nine in 3-point shooting. Five of the last six champions have actually finished top three in 3-point percentage.
In the interest of consistency, however, we'll include the 2010 Lakers and say that the 2019 champion only requires a top-11 offensive rating and a top-15 eFG%.
Who fits the bill (teams in italics also finished top nine in 3-point shooting percentage)? Warriors, Trail Blazers, Raptors, Spurs, 76ers, Clippers, Celtics, Rockets, Bucks, Nuggets
Who doesn't measure up? Jazz, Thunder, Pacers, Nets, Magic, Pistons
Potential outlier: Nuggets
Yes, the Nuggets do fulfill the broader offensive requirements for recent champions, squeaking in at 15th in eFG%. Here's the catch: Of the 14 teams we examined, the only one that finished outside the top six in that statistic had Kobe Bryant and Pau Gasol. It's tough to envision Denver having the same kind of offensive ceiling as the 2010 Lakers in the playoffs.
Defense
| Year | Champion | Def. Rtg rank | Opp. eFG% rank |
|---|---|---|---|
| 2005 | Spurs | 1st | 1st |
| 2006 | Heat | 10th | 11th |
| 2007 | Spurs | 2nd | 2nd |
| 2008 | Celtics | 1st | 1st |
| 2009 | Lakers | 6th | 8th |
| 2010 | Lakers | 4th | 7th |
| 2011 | Mavericks | 8th | 9th |
| 2012* | Heat | 4th | 9th |
| 2013 | Heat | 9th | 9th |
| 2014 | Spurs | 3rd | 4th |
| 2015 | Warriors | 1st | 1st |
| 2016 | Cavaliers | 10th | 13th |
| 2017 | Warriors | 2nd | 1st |
| 2018 | Warriors | 11th | 5th |
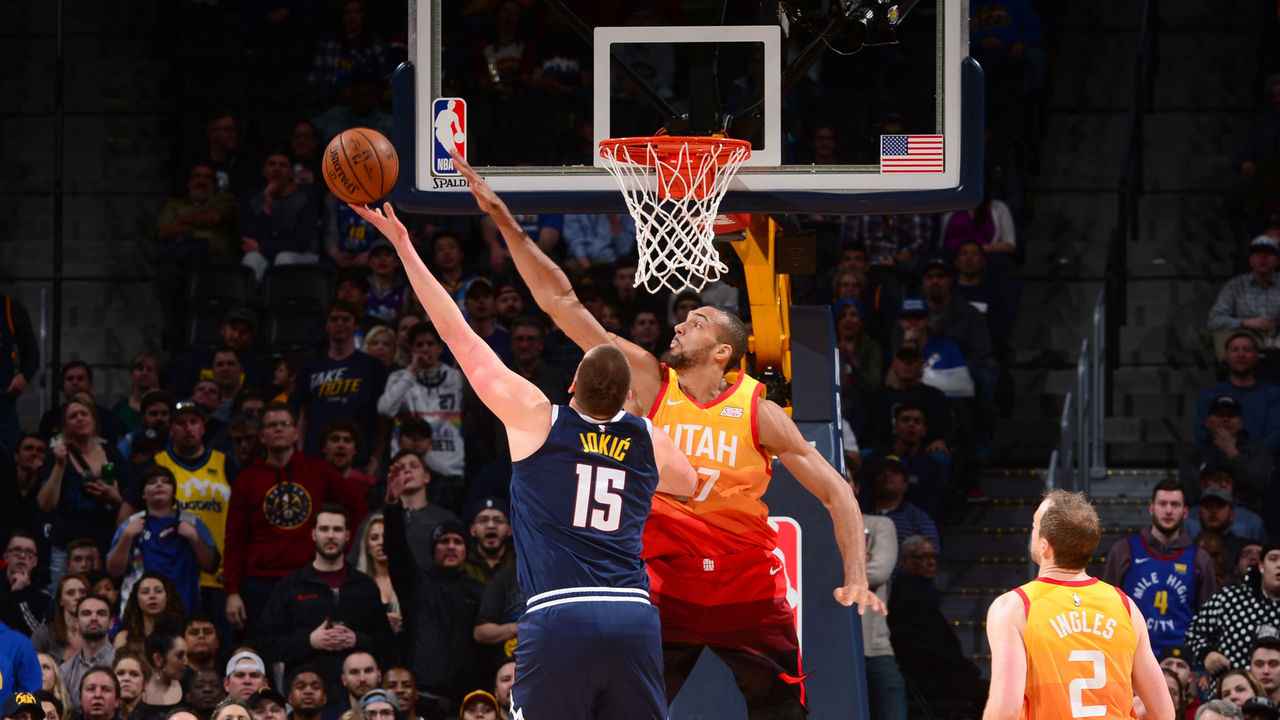
Although offense gets all the attention in the NBA, every champion in our sample still finished in the top 11 on the defensive end, with at least a top-13 mark in opponents' effective field-goal percentage. Also note that 11 of the last 12 champions finished top eight in limiting opponents' effective field-goal percentage.
Who fits the bill? Bucks, Jazz, Pacers, Raptors, Celtics, Magic, Nuggets, Warriors
Who doesn't measure up? Trail Blazers, Rockets, 76ers, Thunder, Spurs, Clippers, Nets, Pistons
Potential outlier: Thunder
Oklahoma City didn't meet the cutoff because its defensive effective field-goal percentage of 52.3 ranked 17th, but that figure undersells the team's capability. The Thunder actually ranked fourth in overall defensive efficiency. Their aggressive, trapping approach can be exposed by offenses that keep the ball moving to find the most efficient shot, hence their poor defensive eFG%. But the individual defense of Paul George; the high-risk, high-reward gambles of Russell Westbrook; and the defensive rebounding of Steven Adams give them championship-level defensive potential.
Star talent
| Year | Champion | Best player rank | All-Stars |
|---|---|---|---|
| 2005 | Spurs | 4th (Tim Duncan) | 2 |
| 2006 | Heat | 4th (Dwyane Wade) | 2 |
| 2007 | Spurs | 3rd (Duncan) | 2 |
| 2008 | Celtics | 4th (Kevin Garnett) | 3 |
| 2009 | Lakers | 4th (Kobe Bryant) | 2 |
| 2010 | Lakers | 6th (Pau Gasol) | 2 |
| 2011 | Mavericks | 9th (Dirk Nowitzki) | 1 |
| 2012* | Heat | 1st (LeBron James) | 3 |
| 2013 | Heat | 1st (James) | 3 |
| 2014 | Spurs | 14th (Duncan) | 1 |
| 2015 | Warriors | 1st (Stephen Curry) | 2 |
| 2016 | Cavaliers | 3rd (James) | 1 |
| 2017 | Warriors | 5th (Curry) | 4 |
| 2018 | Warriors | 8th (Curry) | 4 |
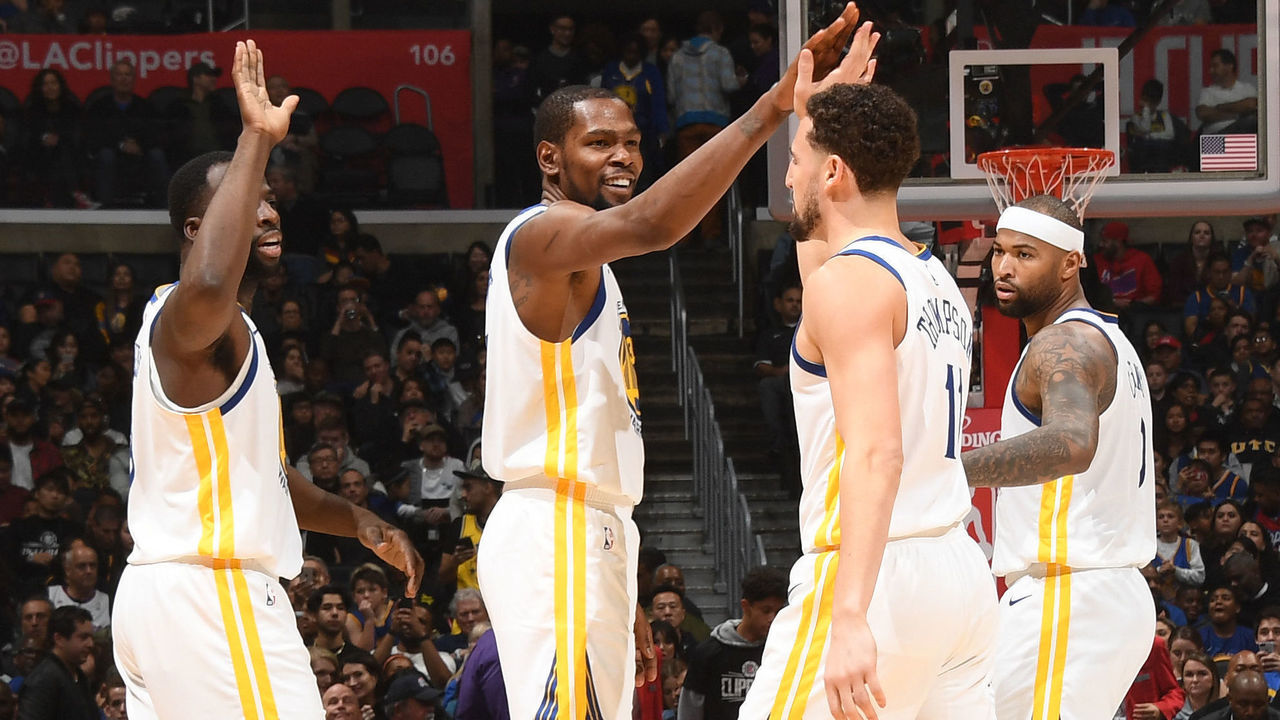
The postseason, let alone the Finals, is about transcendent talent. Depth can carry you to the playoffs and an All-Star can perhaps drag you into the second or third round, but if you want to compete in June, you need a no-brainer, Hall of Fame-type player. There's a reason every Finals for the last 28 years has featured at least one of LeBron James, Kobe Bryant, Shaquille O'Neal, Tim Duncan, Michael Jordan, or Hakeem Olajuwon.
Andy Bailey's data, which determines how stars stack up based on their average rank across a plethora of catch-all stats, gives us a snapshot of just how good each champion's best player was. You'll notice every champion featured at least one All-Star, with 11 of the last 14 teams employing more than one.
All 14 champions featured at least one All-NBA selection (nine of 14 had multiple players on the year-end list), and 12 of the last 14 champions boasted at least one All-Defensive Team selection. But those awards won't be handed for several weeks, so we can't use them to filter this year's squads.
Let's look for teams with a top-14 player in Bailey's catch-all stats and at least one All-Star.
Who fits the bill (multiple All-Stars italicized)? Bucks, Thunder, Warriors, 76ers, Rockets, Nuggets, Trail Blazers, Magic, Celtics
Who doesn't measure up? Raptors, Jazz, Spurs, Clippers, Pacers, Nets, Pistons
Potential outlier: Raptors
Toronto is led by Kawhi Leonard, a former Finals MVP; a second All-Star in Kyle Lowry; and Most Improved Player Award favorite Pascal Siakam. So how did the Raptors fail to meet the prerequisite for star talent? Because Leonard finished 15th when measuring 2018-19 players by their average rank in catch-all stats.
That's obviously a result of Leonard only suiting up for 60 games; the Raptors eased him into things after a quad injury limited the three-time All-Star to nine games last season. Leonard averaged 26.6 points, 7.3 rebounds, 3.3 assists, and 1.8 steals on 49-37-85 shooting, and his peers still tab him as the NBA's best defender.
If you're wondering why some other metrics were left out of this research, they weren't. What I discovered was that assist metrics, rebound rates, turnover measures, free-throw frequency, and opponent 3-point percentages didn't produce trends as consistently as the statistics cited above. The championship teams we examined often finished in the bottom third in at least one of those categories.
On to the results ...
Who's left standing?
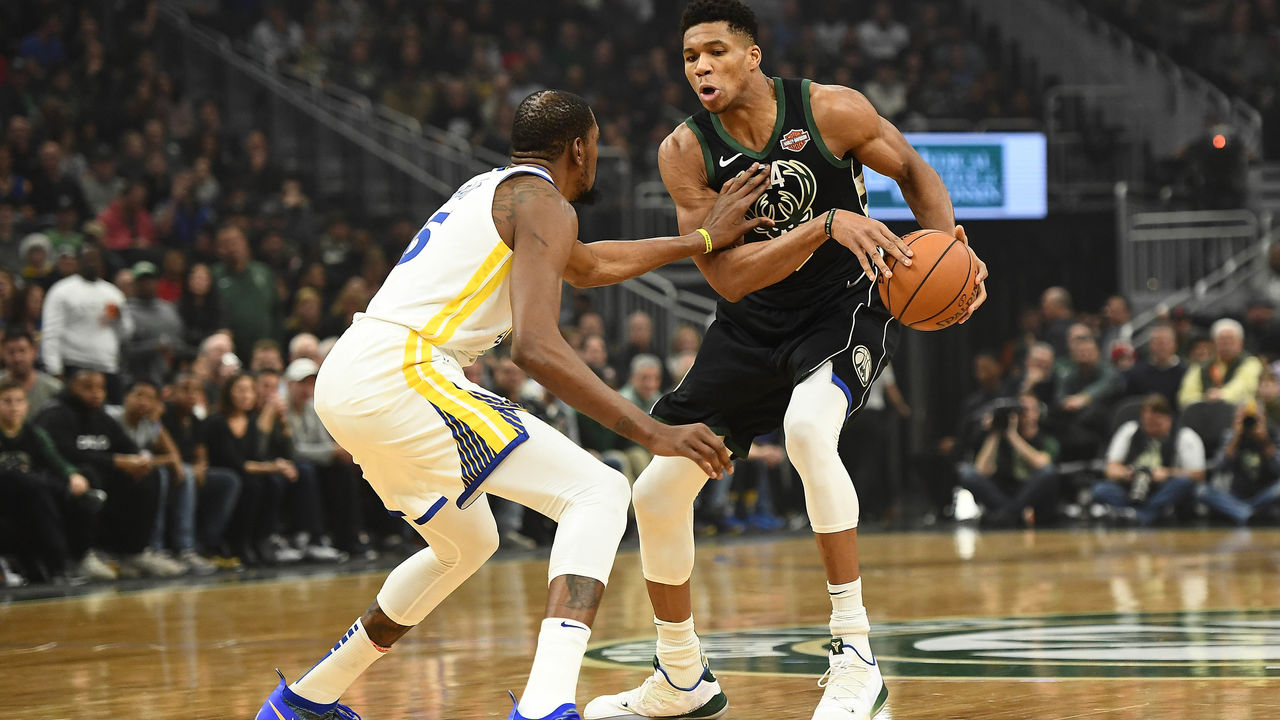
Only two teams managed to check every box. The top-seeded Bucks and Warriors enter the postseason as the clear-cut favorites when considering the statistical profile of an NBA champion.
That said, Toronto's also a capable contender. The only thing that kept the Raptors from acing the test is Leonard finishing 15th, rather than 14th, in those catch-all metrics.
Just missed the cut: Trail Blazers
How snakebitten is this franchise? The only area where Portland didn't measure up was the defensive end. That's brutal considering the Blazers defended at a top-three level (105.6 defensive rating) with Jusuf Nurkic on the court and met the defensive eFG% requirements of a champion before Nurkic broke his leg.
The Blazers may not have been widely viewed as a title threat this year, but had they entered the playoffs with Nurkic, the numbers suggest they could have contended.
Just happy to be here: Nets, Pistons
They're the only two teams that failed to meet a single one of the standards for a recent champion. Nobody's expecting much from these Eastern Conference pretenders.