How to Use Batted Ball and Defense Data for Daily Fantasy Stacking
When it comes to stacking - the strategy of including three or more players from the same daily fantasy lineup - the most common process is to simply load up on hitters facing the shakiest starting pitcher on the slate.
Beyond that, astute DFSers will often look into how a team hits against the handedness of the pitcher they're facing. The Red Sox crush righties? You probably want to stack them against Tigers pinata RHP Anibal Sanchez.
But what if instead of focusing on the relationship between pitcher and batter, we think of stacking in terms of batter versus defense. Is there a simple method to weigh the strengths of the offense against the weaknesses of the defense as a whole to better inform stacking strategy?
What I present is an alternative stacking philosophy based on batted-ball data and the defending team's Ultimate Zone Rating (UZR), a measure of defensive performance, for different position groups. This will give DFSers another layer of analysis to consider in addition to their current methods for creating stacks.
Flyballs to the Outfield
This year, the Tampa Bay Rays and Toronto Blue Jays lead the league in flyball rate:
Unsurprisingly, when you hit the ball in the air as much as the Rays and Jays do, you're going to hit a lot of homers and a lot of extra-base hits (XBH) overall. Tampa Bay leads the league with 65 homers and rank sixth in XBH; Toronto is seventh in both categories, despite an offense that many feel has underperformed to date.
How does this help with stacking? Well, it would be wise to target the part of the field that flyballs are likely to impact: the outfield.
When teams that are high on the flyball rate leaderboard face weak outfield defenses, their chances of recording an XBH improve, which will lead to more opportunities to drive in runs and better scoring position. Basically, the type of stats that help your lineup take down a tournament contest.
Per FanGraphs, here are the least effective outfield defenses at the quarter season mark, ranked by negative UZR, with the value of their outfield arms, range and proclivity for errors included as well:
Does anything stand out about this leaderboard? How about another representative of the AL East in the Baltimore Orioles?
Nolan Reimold has shown slightly above-average range in the 164 innings he's played, and Hyun Soo Kim and Ryan Flaherty have provided 87 combined innings of league-average defense. But anchored by the poor arm and worse range of rookie Joey Rickard, the main outfield configuration with Adam Jones in center and Mark Trumbo in right has been atrocious.
The Blue Jays get to play that outfield 16 more times; the Rays will have 14 more games against the Orioles, eight of them in hitter-friendly Camden Yards.
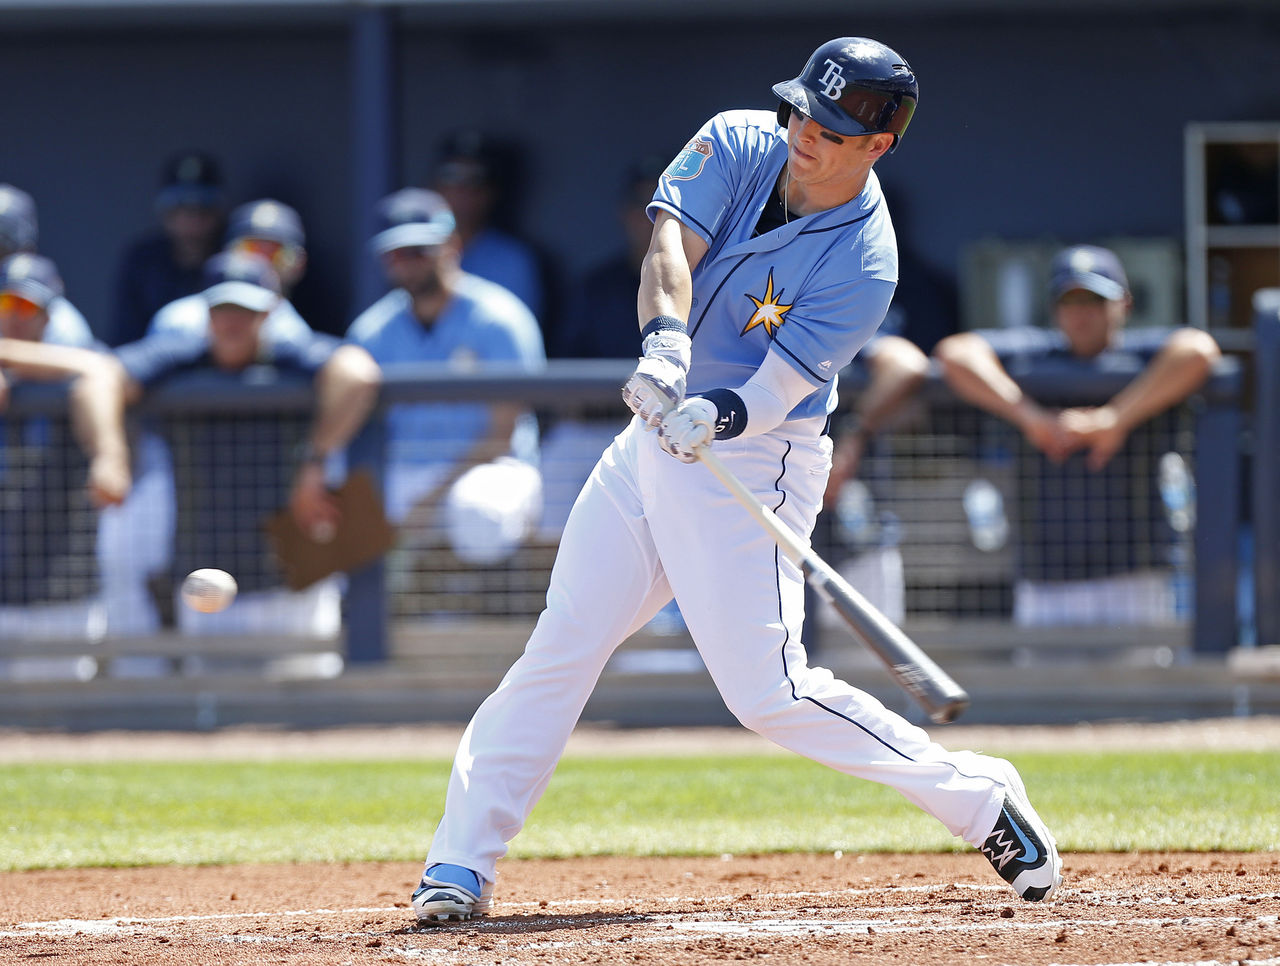
When creating your Rays stack against Baltimore and other weak outfields, target extreme flyball hitters ;like OF Corey Dickerson (53.5 percent), C Curt Casali (51.9), SS Tim Beckham (48.4) and 2B Steve Pearce (46.4).
For Toronto, consider SS Troy Tulowitzki (49.2 percent), 3B Josh Donaldson (47.0), C Josh Thole (42.3) and 1B Edwin Encarnacion (42.2).
We can double-down on this strategy by also taking the batted-ball tendencies of the opposing pitcher into account. The Orioles only feature one man in their current rotation with a flyball rate higher than the current league average of 38.9 percent: Chris Tillman.
When Tillman and his 40.5 flyball rate toe the rubber with the Rickard-Jones-Trumbo unit manning the outfield, be prepared to stack heavily for flyball-heavy offenses. The extra-base hits are sure to follow, and Baltimore's defenders have shown little ability to play better than substandard defense.
Groundballs to the Infield
Using this strategy, we can also take a look at inept interior defenses and how they can help groundball-heavy lineups succeed. Here are the most groundball-heavy offenses to date:
| TEAM | Linedrive% | Groundball% | Flyball% |
|---|---|---|---|
| Diamondbacks | 20.7 | 50.0 | 29.3 |
| Marlins | 21.0 | 49.3 | 29.8 |
| Braves | 20.1 | 49.1 | 30.7 |
| Dodgers | 19.7 | 49.0 | 31.3 |
| Angels | 20.9 | 48.6 | 30.5 |
We'll use the National League East as our subject, though the NL West has a couple of high-end worm-killers as well. Here's the UZR for each infield position in the NL East, as well combined middle-infield and total infield UZR:
Congratulations, Atlanta Braves; not only do you trot out one of the worst middle-infield duos in the league (ranked 27th in double-plays) but every position ranks below average in UZR by a considerable margin.
The worst offenders are SS Erick Aybar (-4.9 UZR), 3B Adonis Garcia (-4.1) and the terrible two-bagger tandem of Kelly Johnson (-2.1) and Gordon Beckham (-2.1).
Unfortunately, the Braves' batters can't face their own defense. If they could, speedy OF Mallex Smith and his groundball rate of 58.6 percent could rack up a couple of hits per game without the ball ever leaving the infield.
And then there's the Marlins.
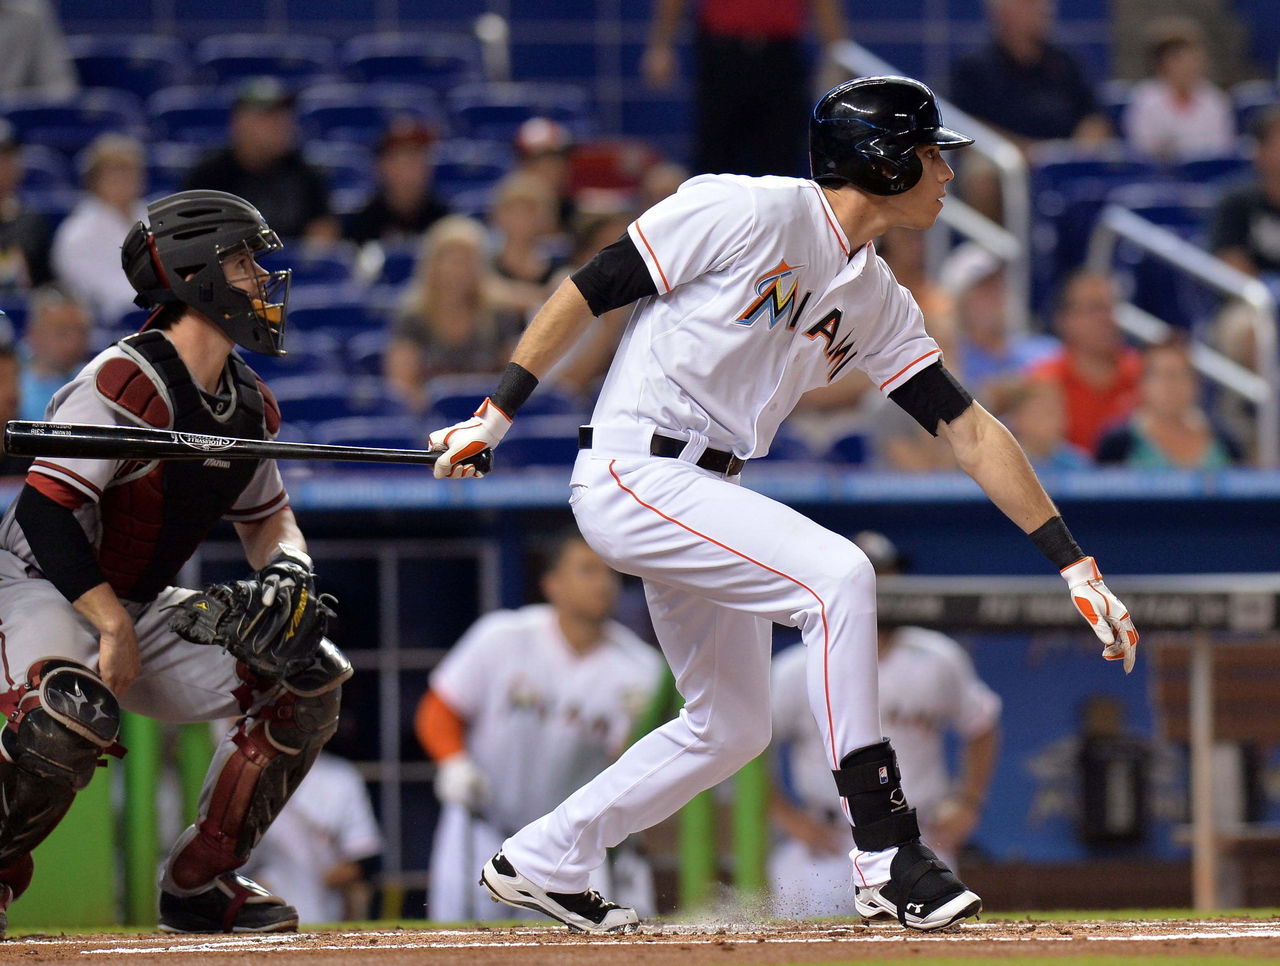
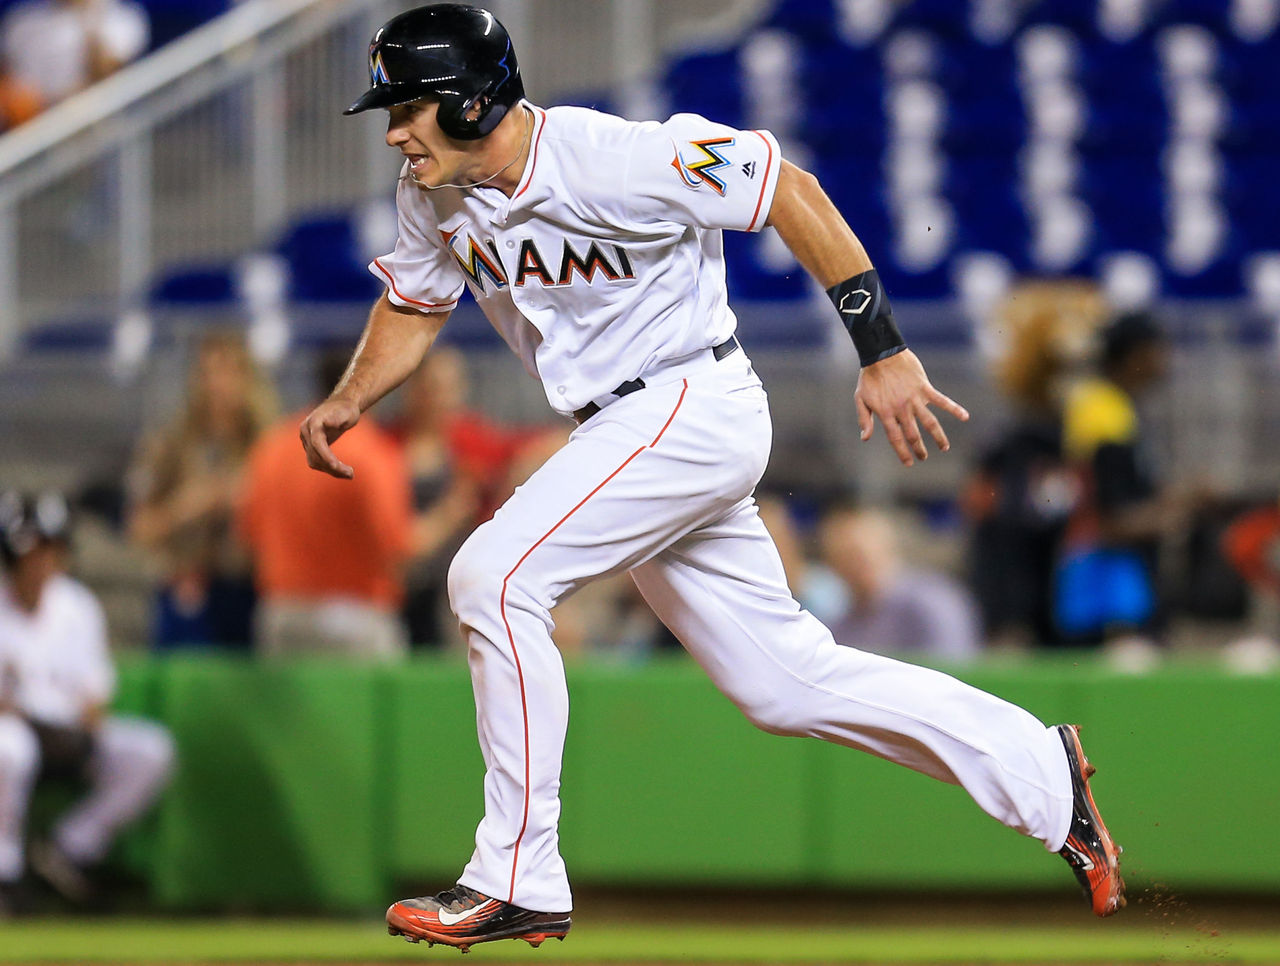
Miami's 49.3 percent groundball rate ranks second in the majors, and they get to face Atlanta another 15 times this season. Their lineup is full of contact hitters with plus-speed that put the ball on the ground at a high rate.
Even with two-time-reigning steals champ 2B Dee Gordon suspended for the better part of the next two months, a Marlins stack could feature OF Christian Yelich (58.0 percent groundball rate), C J.T. Realmuto (54.5), 3B Martin Prado (54.1) and king of the infield hit, OF Ichiro Suzuki (52.6).
On the mound, Braves SP Williams Perez is the biggest offender, testing the infield defense nightly with a GB rate of 59.2. Julio Teheran is slightly above the league average of 41.1, with 44 percent of his hits allowed being groundballs.
With the Braves in a season of transition, it's probably that their infield defense changes dramatically ahead of the trade deadline. Until then, count on a high number of misplayed groundballs.
Atlanta might not be as bad as Baltimore in terms of misplaying deep balls, but a series of groundball hits is still a death by a thousand paper cuts, creating fantasy value for teams that can take advantage of their obvious weakness across the board.
HEADLINES
- Mitchell scores 42 as Cavs defeat Magic to extend winning streak to 4
- Team USA's choice for Olympic flag football is obvious
- Cole makes 2nd spring outing after elbow surgery, allows home run to Bregman
- Caps' Dubois issued match penalty for intent to injure Blues' Thomas
- Grizzlies' Morant out for rest of season due to elbow injury