'Open people's eyes': How the NHL's evolved in the decade of data
The curly-haired chemist is working away in a San Jose lab. He's wearing a white lab coat, safety goggles, and nitrile gloves. Flasks are stirring on a hot plate with temperature monitors nearby. The lab, run by the electric car battery company QuantumScape, stores various solvents and inorganic powders - any material that might mix to make a lithium ion battery.
The chemist's cell phone rings. He finds a quiet area of the lab to take the call.
Hockey Hall of Fame forward Ron Francis is on the line. It's the 2014-15 season, Francis' first as general manager of the small-market Carolina Hurricanes. Francis asks the chemist - who's assumed a part-time consultant role with the NHL team - about a few players. How would you rank them?
The call is short. The chemist slides his phone into his pocket, slips his gloves on, and walks to his work station. Back to the day job for Eric Tulsky.

If Hollywood were to produce hockey's equivalent of "Moneyball," that scene would surely make the final cut. It feels scripted - yet isn't. Tulsky, an Ivy League-educated, Ph.D.-wielding scientist with a well-paying Silicon Valley job, was caught between two worlds a decade ago. He was thriving as an inorganic chemist and in his side hustle as a data-driven hockey analyst.
"I felt like, from the start, that they wanted to hear what I wanted to say," Tulsky said of the Hurricanes. "I still had to earn their confidence in trusting my opinions. But they wanted to hear it from the outset. And that was big."
Tulsky, now 49, left California and science for North Carolina and a full-time position with the Hurricanes ahead of the 2015-16 season. Since then, he's ascended to assistant GM under GM Don Waddell (who replaced Francis in 2018) and interviewed for GM openings in multiple other markets.
Below is the story of Tulsky's evolution from outsider to insider, as well as the rise of statistical analysis within NHL teams and the greater hockey universe.
Primitive advanced statistics like Corsi, PDO, and zone starts were developed and evangelized on blogs and social media websites in the mid-to-late 2000s.
These stats and the insights gleaned from them went mainstream in the early 2010s, capturing the imagination of NHL owners and executives. The analytics movement reached a tipping point in the 2014 offseason as thought leaders like Tulsky, lawyer Tyler Dellow, engineer Tim Barnes, and stock trader Sunny Mehta were snapped up by teams looking for an edge. They wanted exclusive access to minds publishing probing hockey analysis online.
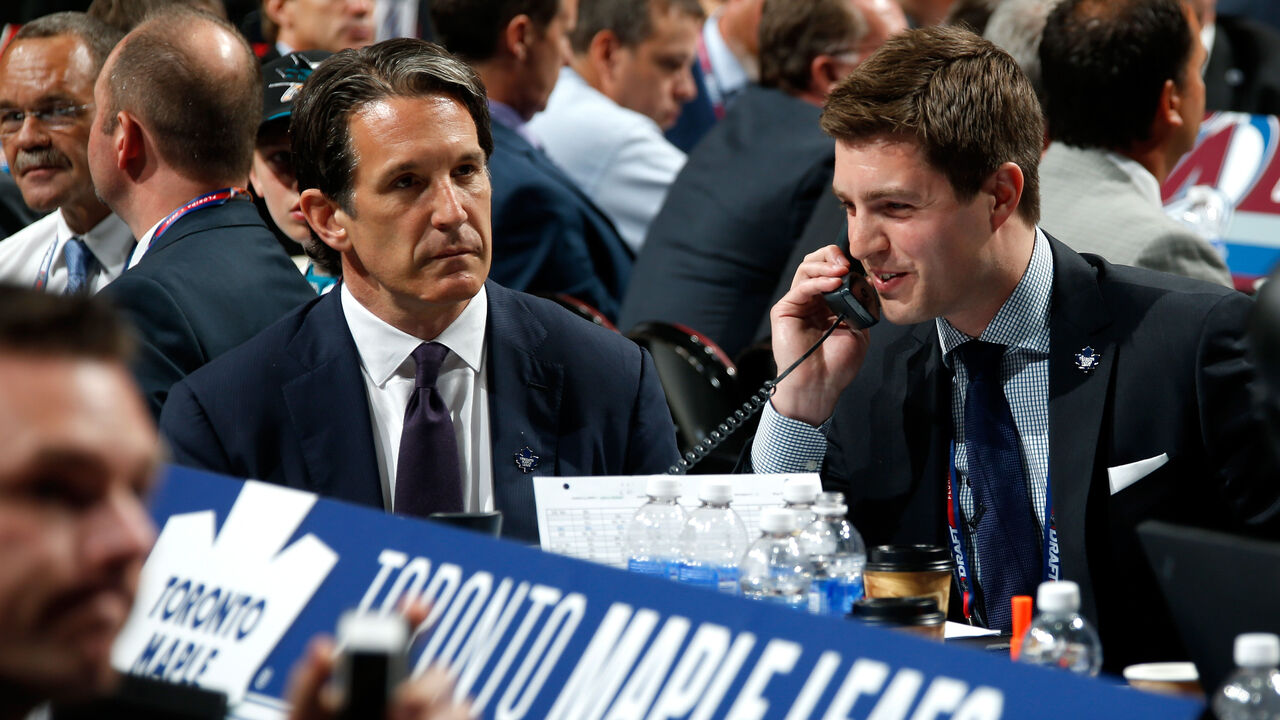
The Toronto Maple Leafs made the splashiest hire of the so-called "Summer of Analytics" when president Brendan Shanahan named 28-year-old Kyle Dubas assistant GM. Despite his deep roots in the game, Dubas had been billed the Theo Epstein of hockey - a stats-loving rising star. He soon formed a "research and development" group within the hockey operations department.
Before the 2014 hiring spree, about 15 people were working in analytics roles. The headcount for analytics staffers has since exploded to nearly 150.
According to online staff directories, 2023-24 media guides, and additional reporting by theScore, 22 of 32 teams - or 69% of the league - currently employ between two and five people in a hockey data-related capacity.
The Chicago Blackhawks employ a league-high 11 analytics staffers under 35-year-old GM Kyle Davidson. The Leafs and Dubas' new team, the Pittsburgh Penguins, employ nine staffers each. And the New Jersey Devils employ eight, including Dellow as senior vice president of hockey strategy and analytics.
Mat Sells, the Minnesota Wild's VP of hockey strategy, frames the current investment in analytics this way: some franchises hired a stats person in the mid-2010s for the sole purpose of signalling to fans that they had a pulse on the space. Now, he said, "every single team understands at least the most basic usage of statistical information and applies that to their operation."
The appetite for statistical analysis varies from person to person, and especially in hockey, given the sport's speedy, flowing, and chaotic nature. Still, it's increasingly rare to find someone working in hockey who dismisses it.
"Analytics, at the end of the day, is just a fancy word for information," one team's director of hockey analytics said. (Some sources for this article were granted anonymity because they're not permitted to speak with reporters.)
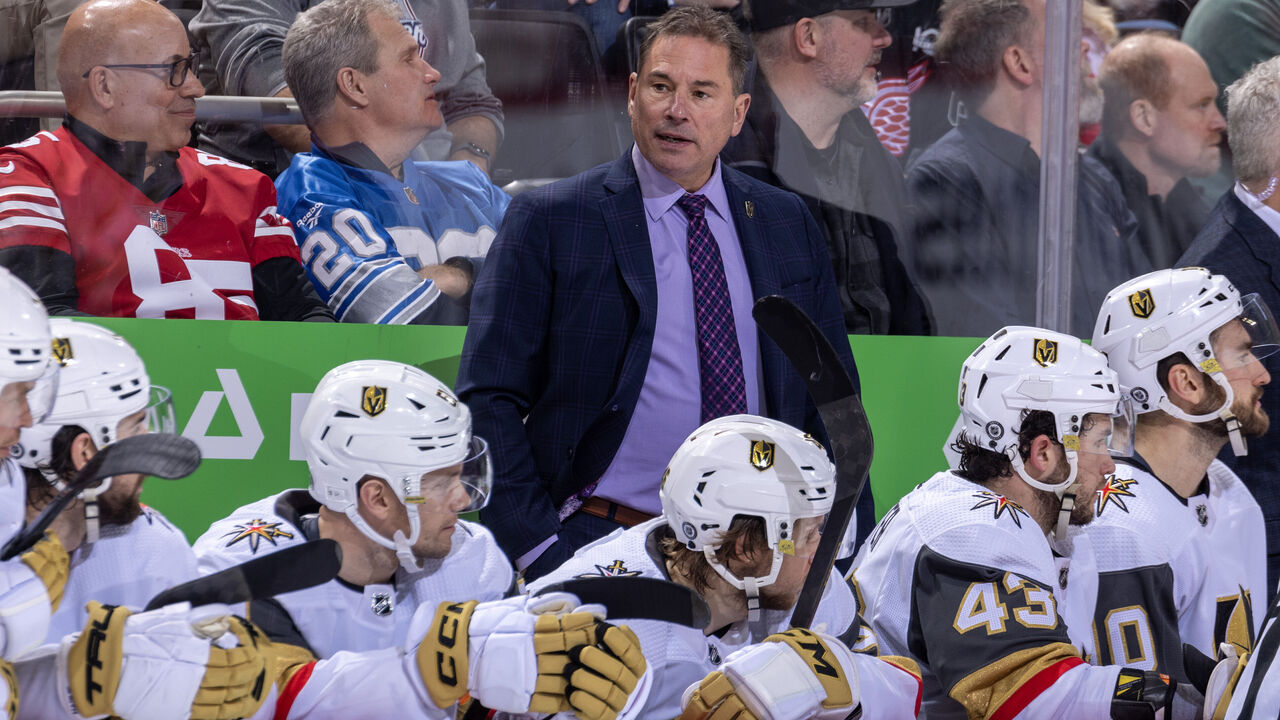
Vegas Golden Knights head coach Bruce Cassidy sees a parallel between the early days of analytics and the early days of texting. Texting was originally scoffed at in his social circle - "Just call me, what are you texting me for?" he recalls a friend saying in the mid-2000s - but it slowly became part of daily life. People realized texting's an efficient way to communicate and adjusted their habits.
"Players determine success, not numbers," Cassidy said. "But it sure can help you coach your players. I think the data itself has come a long way, and the coaches I think who are current will use analytics to their advantage."
Corsi, which quantified overall shot attempts, including those that were blocked or missed the net, has been replaced by nuanced expected-goal models. Scoring chances can now be broken down by type: forecheck, cycle, rush, rebound, deflection. Shot speed, skating distance, puck-battle wins, strength of opponent, zone denials, and goals saved above expected are among countless metrics.
We've learned to lean on data in our personal lives, Cassidy notes, so why not in hockey? "You use good data," he said, "and all of a sudden you can make better decisions on how to eat, how to exercise, how to raise your kids."
Cassidy's conversations with Vegas' stats people often revolve around 10-game segments. Director of hockey analytics Dustin Walsh and director of hockey ops Tom Poraszka will share their thoughts on, say, the struggling power play. Maybe the defending Stanley Cup champions aren't generating enough offensive-zone time. Or zone-entry and puck-recovery rates have fallen off a cliff. Or they're too often losing the draw to start a power play.
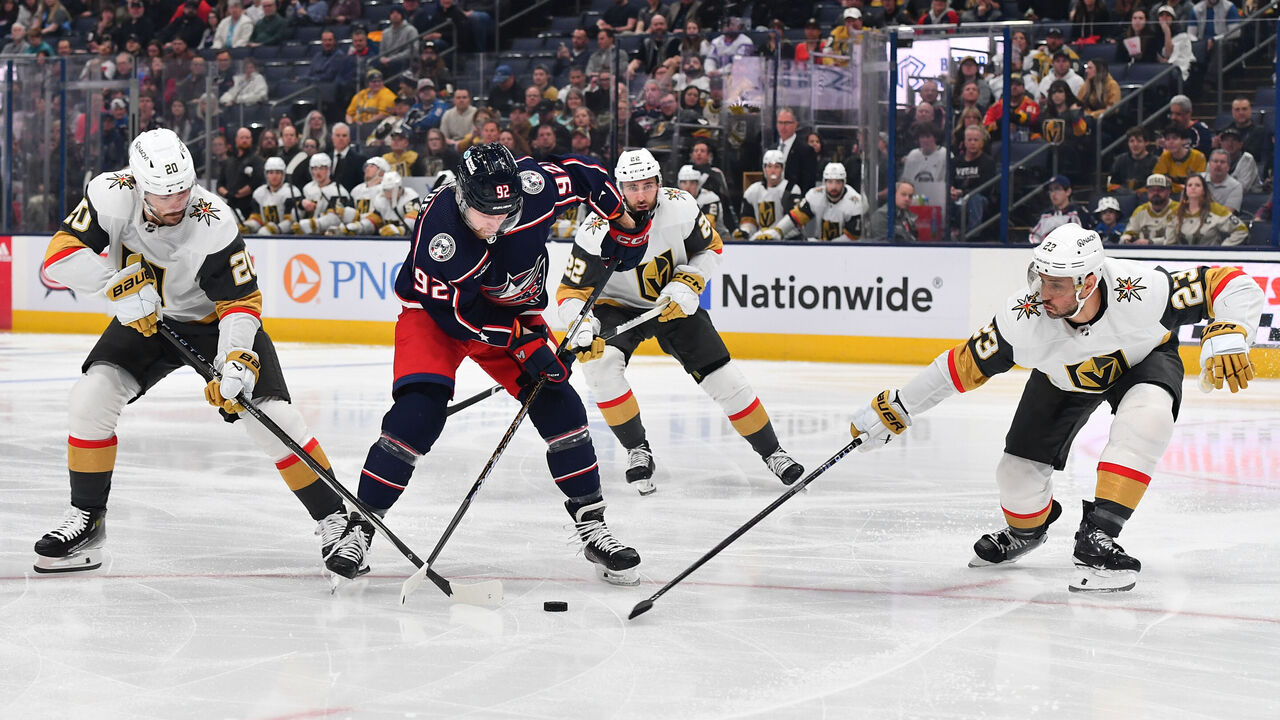
Numbers can also be a check on team identity for Cassidy. Vegas famously packs the middle of the ice on defense to limit shots from prime scoring spots, so it's OK if the club ranks high in defensive-zone time. It's not OK, however, if it ranks high in high-danger scoring chances against.
"I can look at certain areas and say, 'Yeah, that number's no good. That's one of the reasons our game has slipped a little bit,'" Cassidy explained. "Other numbers could be there - high or low - and they do not go hand in hand at all with what's going on on the ice because it's not relevant to how we play."
Pete DeBoer of the Dallas Stars likes how advanced stats can help him and his staff "get into the deep layers" of a player's game. He'll take a nugget of data and combine it with video clips and his own intuition as head coach to deliver a message to a player that's both comprehensive and individualized.
"The ability to compare when a player was playing at a really good level to when he's slumping, and to show them some data about it - other than just listening to a coach drone on about his opinion and why he's not playing well - can be really helpful," said DeBoer, an NHL coach since 2008.
Young players are part of tech-savvy Generation Z. They want information.
"Their faces are buried in their phones all day long," DeBoer laughed. "They expect data. They expect engagement. They expect feedback. It's changed coaching. It's definitely made us more accountable as coaches to the messaging we're giving. You have to go another layer beyond just your opinion, and I'll be honest with you, sometimes that changes your opinion, too, when you dig into it. So, that's a good thing."
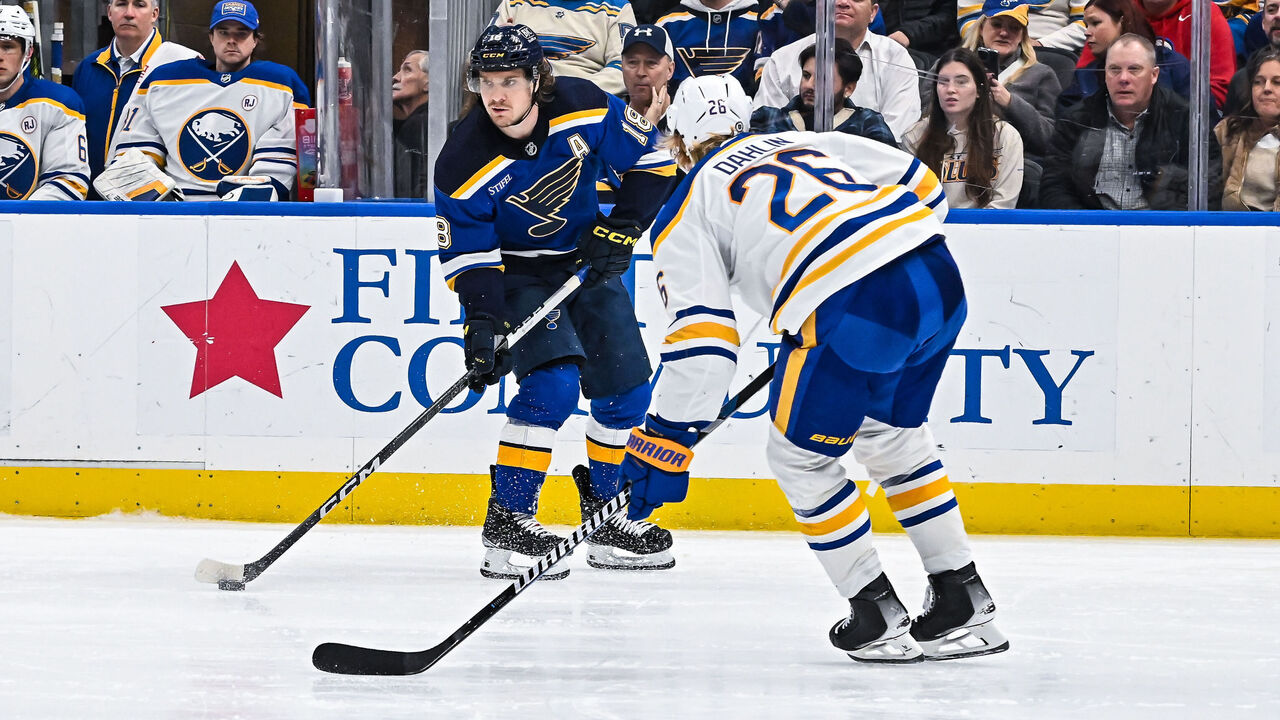
St. Louis Blues center Robert Thomas is a self-described "hockey nerd" who tunes into NHL games in his spare time. He'll watch for pleasure or to study players or teams. At the rink, the 24-year-old is treated to regular presentations from Blues goaltending coach David Alexander, who uses data to break down recent goal-scoring trends to a group of curious players.
"This year a lot of tipped goals have gone in. A lot of back of the net, to-the-slot plays," Thomas said of two examples. "Those types of things. There's probably like 25 different categories you want to look at, and it really tells a big story about the way goal scoring has changed over the last two, three years."
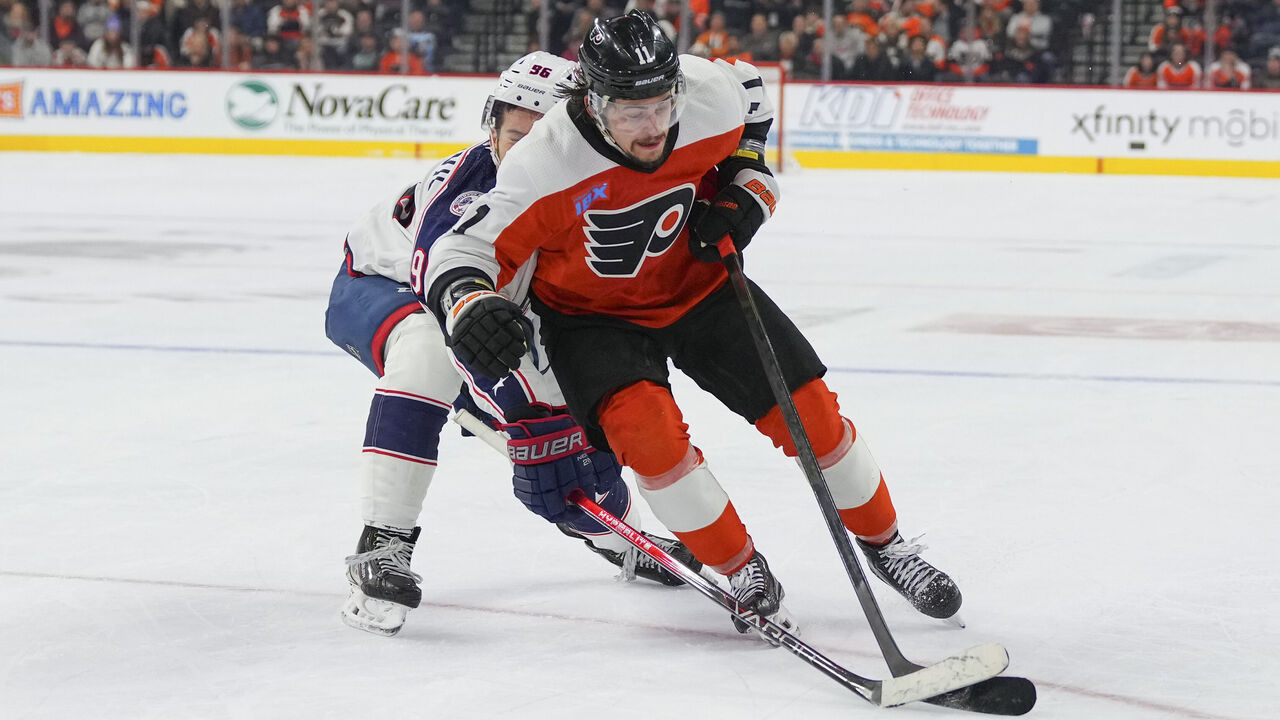
Engaging directly with the data didn't come as naturally to Travis Konecny. But towards the end of the 2021-22 season, the Philadelphia Flyers winger took the advice of then-special assistant to the GM (now current GM) Daniel Briere and dove into details of his game with video clips and advanced stats.
Briere and director of hockey analytics Ian Anderson identified troubling patterns: Konecny was too frequently firing pucks from the perimeter, and wasn't funneling the puck to the interior enough as a passer. He needed to overhaul his offensive-zone habits to increase Philly's odds of scoring.
"It wasn't that I wasn't working hard. It was just that I was going to the wrong areas of the ice," Konecny said of what he learned.
It ultimately helped Konecny, a 2015 first-round pick, get back on track. He recorded 31 goals in 60 games in 2022-23 and earned an All-Star nod this season. "It kind of turned me into a different player," the 27-year-old said.
While Thomas, Konecny, and others have benefited from statistical analysis, there's danger in overexposing athletes who perform best on instinct. Front offices and coaching staffs pick their spots on both the individual and team level. As one assistant coach explained, an analytics staffer will provide the coaches with a handful of insights ahead of a game, and then the coaches relay one or two of those data-driven points to the players. Less is more.
"Let's get on them on the forecheck," the coach said of the phrasing he might use if the opponent ranks bottom five in puck retrievals.
Vegas operates similarly. Cassidy throws strategies, not data, at his group.
"I don't think players are ready for that," he said.
Dubas and former Arizona Coyotes GM John Chayka are often viewed as the ambassadors of the analytics movement. What's usually overlooked is that both had skin in the game long before the spotlight. Dubas was a stickboy and scout for an OHL team and became a certified NHLPA player agent in his early 20s. Chayka, prior to co-founding the analytics company Stathletes, was an OHL-drafted junior-A forward who dabbled in video and fitness coaching.
In contrast, Tulsky never played organized hockey and had no institutional ties for the first 35 years of his life. His entry point wasn't glamorous, either. He wrote about aging curves, penalty differential, draft slot value, and neutral-zone play. To a lot of the analytics staffers in the league today, it's Tulsky's nontraditional path - not Dubas' or Chayka's - that's relatable and inspiring.
"Of the people in his lane, Eric is probably furthest ahead," said one team's director of hockey analytics. The director cited Tulsky's climb in Carolina: hockey analyst, to manager of hockey analytics, to VP of hockey management and strategy, to assistant GM of analytics and professional scouting.

Born in Port Huron, Michigan, Tulsky moved to Philadelphia at age four. He was a diehard fan of Philly's sports teams, including the Flyers, though he gravitated toward baseball. The family had partial season tickets to Phillies home games, and young Tulsky devoured books by baseball analytics pioneer Bill James and obsessed over the stats-centric Strat-O-Matic board game.
"He's had his own internal drive forever," said Tulsky's dad, Rick, a Pulitzer Prize-winning investigative journalist. His mom Kim, a retired commercial lawyer, likes to tell a story about her four-year-old waking her up one Sunday morning to pass along a bit of urgent news and analysis: He'd learned the sum of five plus four.
"It's nine! Do you want to know how I know?!" young Tulsky asked his mom.
"Sure, honey," Kim responded.
"Well, five plus five is 10, and four is one less than five. So that means five plus four must be one less than five plus five. So, nine!" he exclaimed.
Eric went on to earn a degree in chemistry and physics from Harvard and a Ph.D. in chemistry from the University of California, Berkeley. He conducted a two-year postdoctoral study at the Naval Research Lab in Washington, D.C., then spent 10 years working for several innovative companies as a scientist and manager. Tulsky was tasked with solving problems in DNA sequencing, solar energy, displays, and energy storage. He currently holds 26 U.S. patents.
"Eric can get deep into the details but also will have a higher-level view of everything going on at the company and even the industry," said Craig Stolarczyk, one of Tulsky's former coworkers at Life Technologies (which was later acquired by Fortune 500 biotech company Thermo Fisher Scientific).
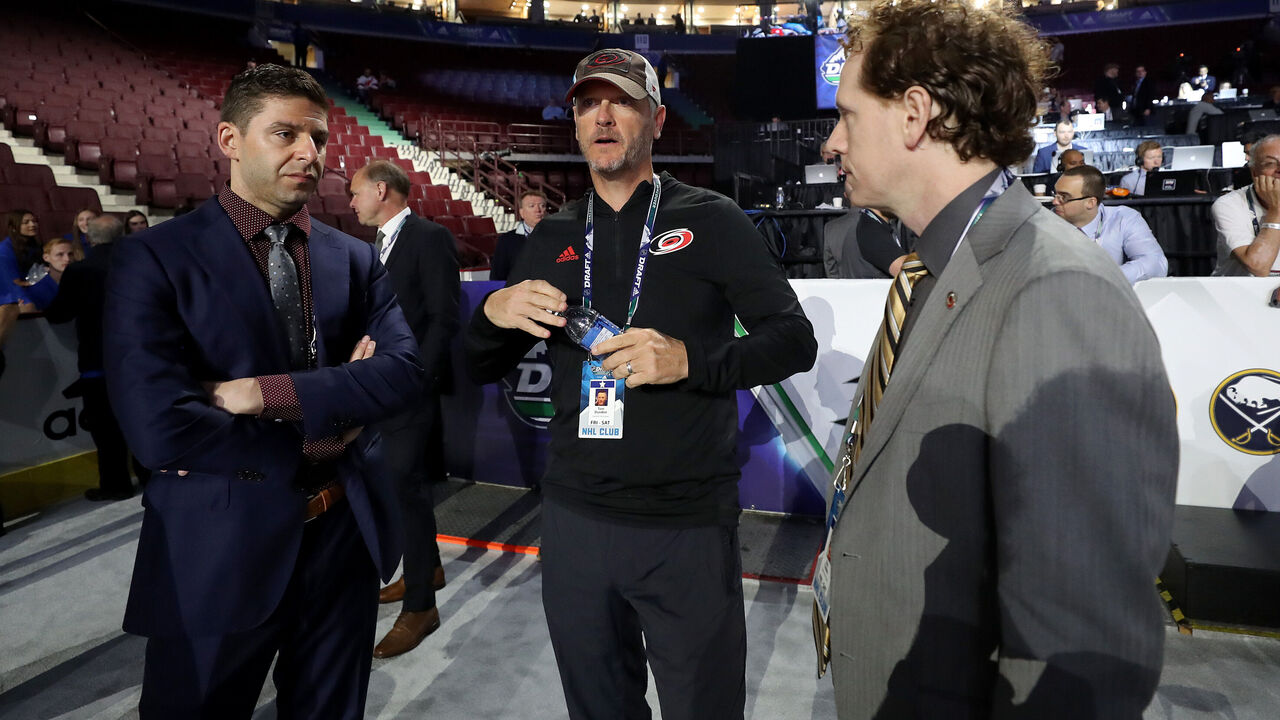
Aram Yang, who worked with Tulsky at QuantumScape, also has chemistry degrees from Harvard and the University of California. He notes that Tulsky is exceptionally bright, even compared to their high-achieving peers. He excels at translating technical concepts into plain language, Yang adds, and is "full of empathy."
"If you were to make a list of the brightest people you know, and then make a list of the most empathetic people you know, how many people would be on both of those lists?" Yang asked rhetorically. "Not many, right? But Eric is."
Tulsky's current gig pulls him in every direction. He's involved in all Hurricanes player personnel decisions, assists with contract negotiations and salary-cap compliance, and oversees 10 people working in analytics or pro scouting.
Carolina is one of several clubs to build an internal platform to serve as a one-stop shop for scouting reports, stats, and video. "We try to house all of the information we have in there, no matter what form it is or wherever it came from," Tulsky said about CHIP, the Carolina Hurricanes Information Portal.
The team's analytics group (the "hockey information group," officially) is large relative to the overall size of the hockey ops department, with a senior developer, two data scientists, a software developer, and a data engineer reporting to Tulsky. Waddell credits hands-on owner Tom Dundon, who purchased the Canes in 2018 and runs a private investment firm, for doubling down. "The analytics group was already up and running, but Tom brought a different mentality," Waddell said. "We want to be the best we can be, and make the best decisions we can, so we've put resources into that group."
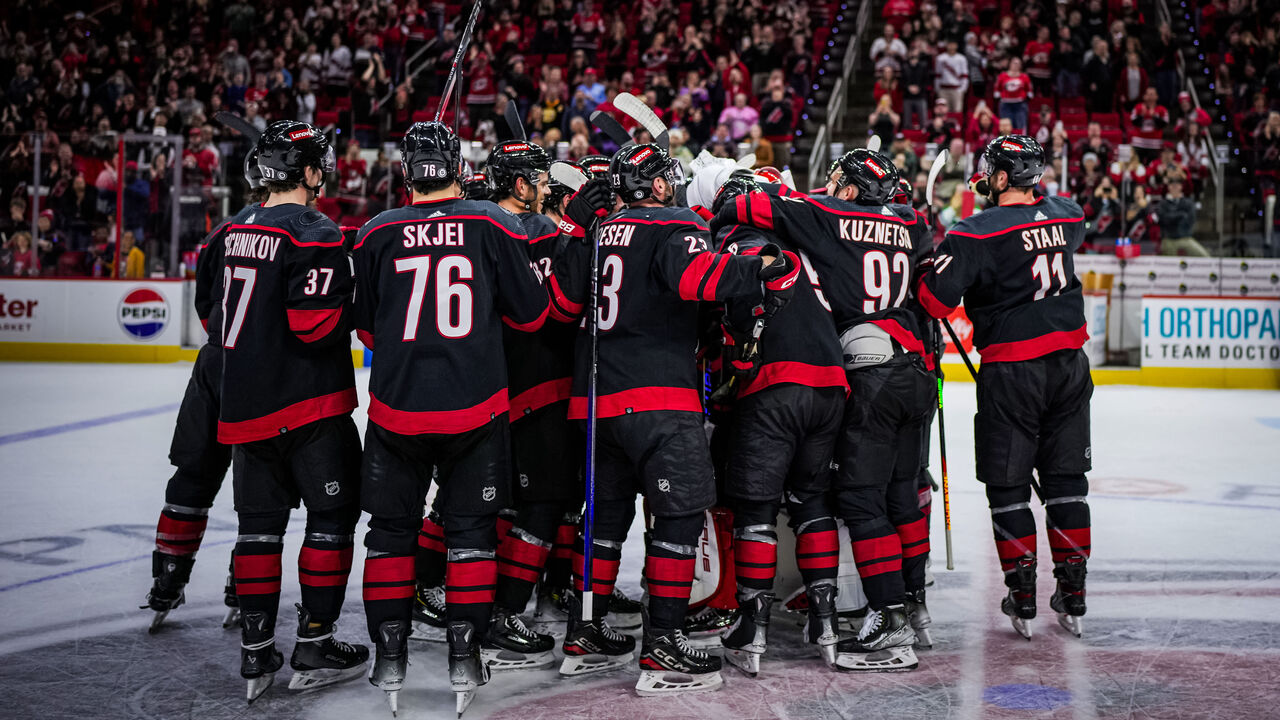
Unlike many other clubs, the Hurricanes have distinct team characteristics.
They play a forecheck-heavy style and fill their roster with players suited for it. They seem to place a strict value on every asset (each player, pick, prospect) and rarely move off those valuations. They let veterans walk in free agency, swap picks more than anyone else, and prioritize upside in the draft.
This well-defined identity and strategic vision paid off when a player tailor-made for coach Rod Brind'Amour's system recently became available. Contending Carolina was able to acquire star forward Jake Guentzel because the front office stockpiled enough salary, picks, and prospects to take that big swing.
One advantage to having a lean operation is that every executive feels heard. That inner circle includes Dundon, Waddell, Brind'Amour, Tulsky, and Darren Yorke, the assistant GM in charge of amateur scouting. It turns out disagreeing, or challenging the status quo, is another distinct characteristic.
"Every person on our staff is comfortable telling their manager and their manager's manager that they disagree with them," Tulsky said.
"I remember somebody I worked with telling me once, 'If you're just going to agree with everything I say, there's no reason for me to pay you. I already know what I think. The only reason to have you here is because sometimes you'll tell me something that I didn't think about. That's what you're getting paid for: to disagree.'"
The NHL has evolved over the past 10 years at the macro and micro levels.
Take power-play deployment. All but four top units in the league currently feature four forwards, according to Daily Faceoff's lineup tool. Did the shift from using two defensemen to one occur in response to undeniable statistical evidence? Or did the numbers simply accelerate the shift?
"Honestly, it's hard to say what's data driven and what's data reinforced," one team's director of hockey analytics said of a decade in which the NHL goals-per-game rate has jumped from 5.46 to 6.22 for a variety of reasons.
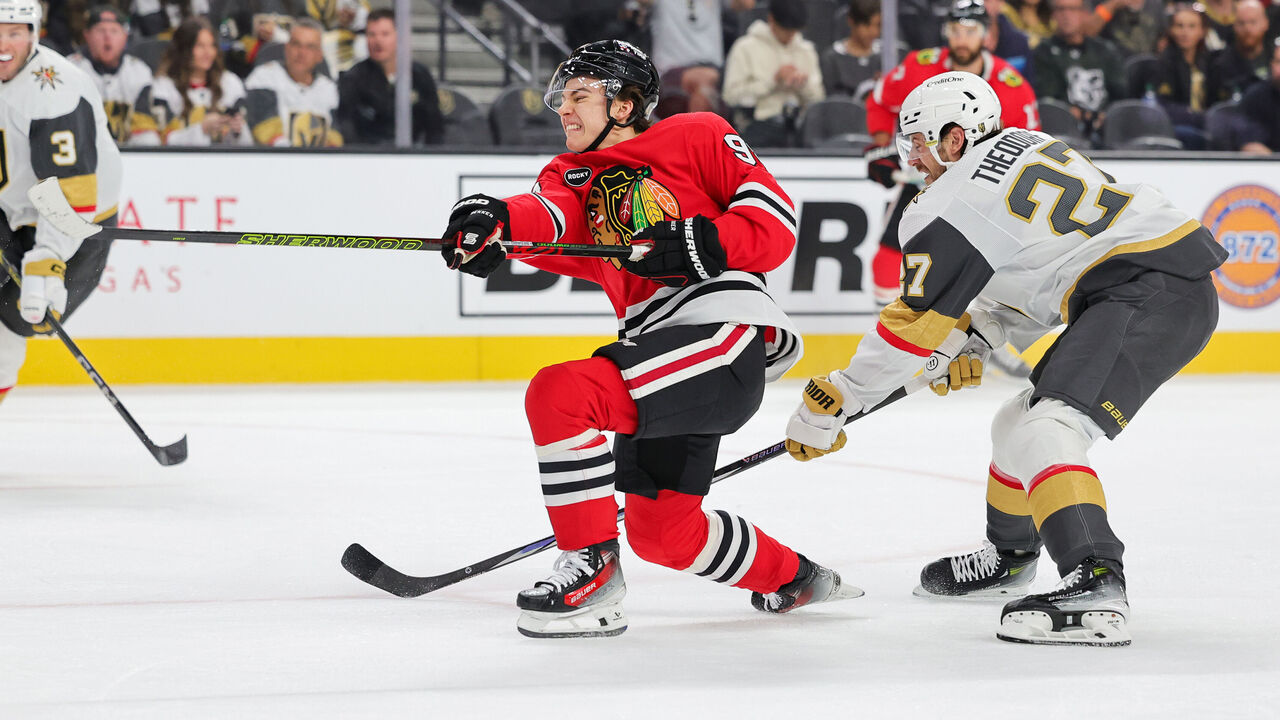
Yet one macro trend seems strongly influenced by analytics. Mike Kelly, an NHL Network analyst and Sportlogiq's director of hockey analytics and insights, believes the industry-wide understanding of shot quality can be linked directly to a change in tactics. Point shots are out and point-blank shots are in thanks to heat maps and expected goals models.
The 2015-16 season was the first that Sportlogiq tracked NHL games. That year, 30% of all shot attempts were categorized as "slot shots," or attempts originating from the most dangerous area of the ice. The number rapidly increased to 40% by 2018-19 and hasn't dipped below 37% over the past five seasons.
"What the data has done is open people's eyes," Cassidy said. "You used to think, OK, you've got a two-on-one, come down on the goalie, and, 'Shoot! Shoot! Shoot!' Then the data says, well, most of the time goals are scored with the goalie moving. So now we're going down on a two-on-one break, and we're like, 'Look for a play. Try to freeze the goalie. Look for an east-west play.'"
Another team's director of analytics brought up aging curves. Front offices have a firmer grasp on performance peaks and valleys and are anticipating players' declines. The veteran so integral to dressing-room culture isn't getting extended and is aging out of the league earlier than prior eras.
"The NHL is an efficiency contest. It's about finding value," said Kent Wilson, who's been writing about hockey through a statistical lens for nearly 20 years.
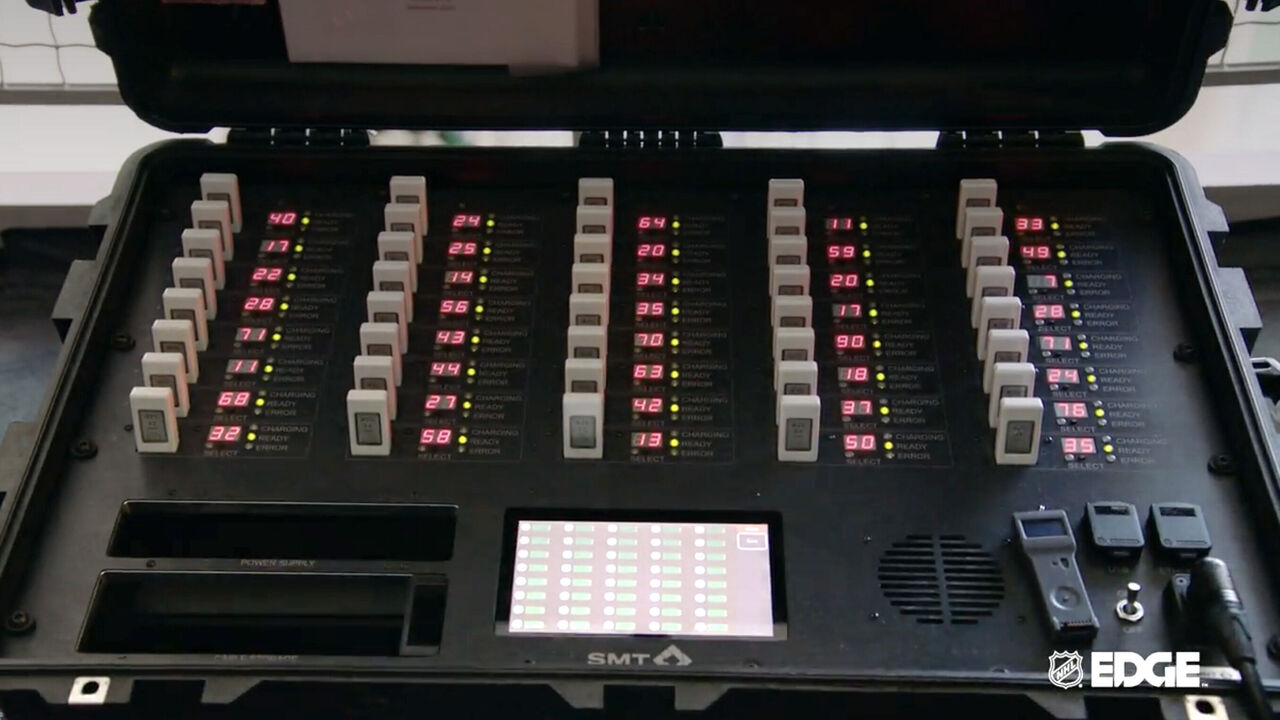
In 2024, NHL teams have access to mountains of data through third-party providers like Sportlogiq, Stathletes, Clear Sight Analytics, and SportsMedia Technology (SMT). Shots, hits, time on ice, and other traditional stats continue to be logged by off-ice officials, but anything remotely complicated - like zone entries and exits - is handled by tracking and artificial intelligence.
NHL rinks are equipped with up to 20 cameras while player jerseys and pucks are tagged with infrared emitters to create X, Y, and Z coordinates throughout the game. This raw location data collected by SMT is fed straight to teams. It also helps generate the "measurable" stats found on NHL Edge, the player- and puck-tracking hub launched by the league earlier this season.
We now know, for instance, this season's hardest shooter (Colin Miller) and fastest skater (Owen Tippett). The NHL views this product as a key engagement vehicle for fans and media that'll become more sophisticated over time.
"One of the challenges with hockey in general is that it's a very chaotic sport with lots of substitutions and where the best players play less than half the game," NHL group VP of statistics and information Russell Levine said. "We're hopeful that people can take the sort of information we're presenting and use it to better understand what makes certain players and teams effective."
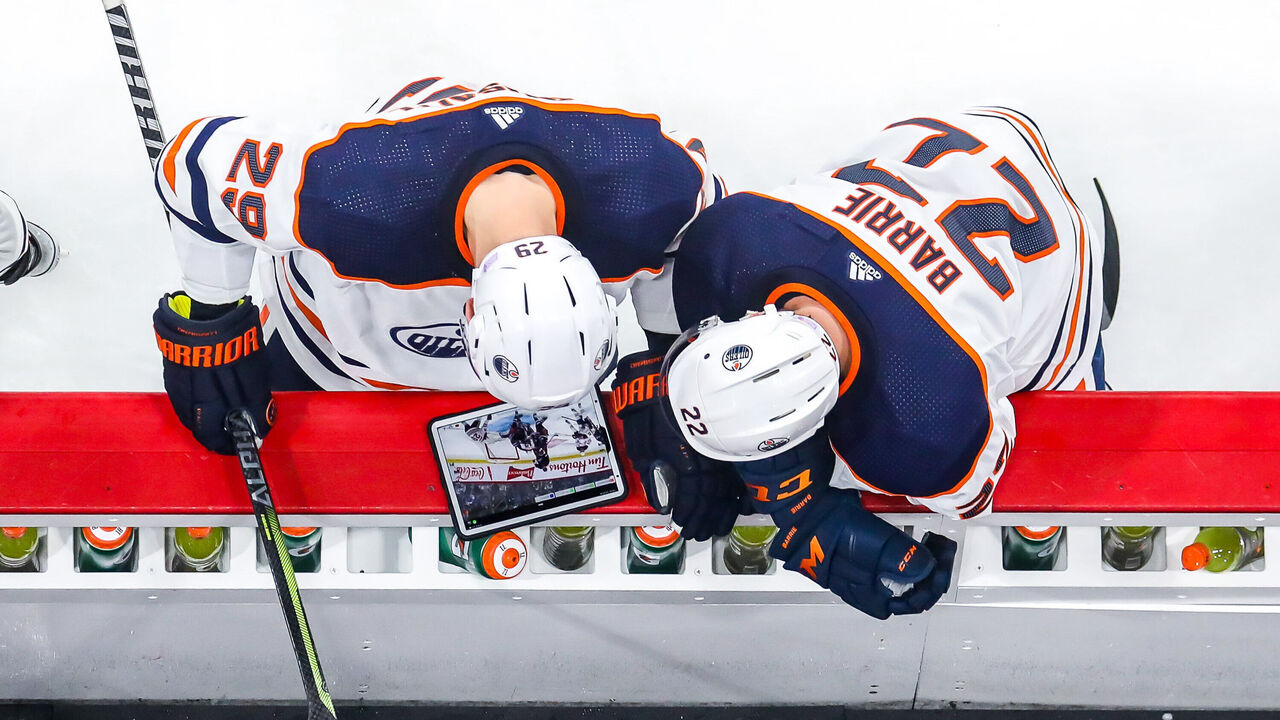
A few people interviewed for this article wondered if the third-party providers will eventually be able to unearth data insights that can help better separate individual player performance from coaching systems. Others are interested in one day accessing data that can help better quantify hockey sense and hockey IQ.
For example, if there was a skating route efficiency metric, the analysis around slow but incredibly smart players could become more nuanced.
"To be able to say, well, we've got this prospect we might want to draft or this NHLer on the free-agent market we might want to sign, and skating's been a bit of a detriment, but he is just so clearly elite at getting to the right spots that it doesn't matter - that for sure would be massively valuable," Kelly said.
Wilson would like to get his hands on data relating to player types and teammate chemistry. Corey Sznajder of the All Three Zones manual tracking project is keen on learning about the efficacy of specific special-teams formations, and which players can handle disruptive shooting environments.
"I'd like to see a lot more data on how much space a player has around him and which players can score when they're being covered," Sznajder said.
theScore floated a few of these ideas, plus the expected impact of AI on data and also productivity within organizations, to one director of hockey analytics. The director offered his two cents, and then added, partly in jest, "OK, now you understand why we have so much to do."
At this point, most clubs have access to the same, or close to the same, raw data. "How you weaponize that information for insights, and how you communicate it, is the biggest competitive advantage right now," Kelly said.
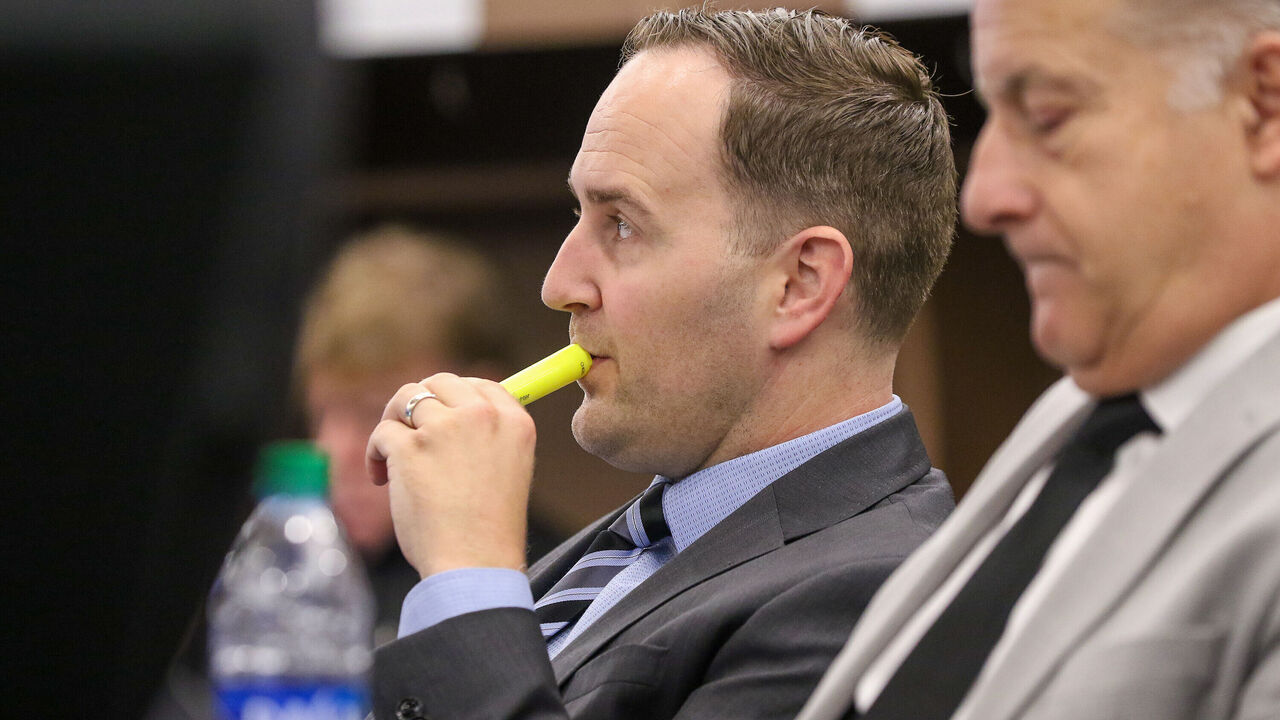
Speaking to his own experience, Sells - who heads Minnesota's two-person analytics group - says that the amount of data or the number of staffers working with it is irrelevant if the rest of hockey ops doesn't take you seriously.
"You could have people doing groundbreaking work in the industry," Sells said. "But if amateur or pro scouts, or development people, or the coaches, or the people managing the salary cap don't understand the information or see how it's applicable or valuable, then it probably won't be used properly."
Traditional and nontraditional hockey people finding common ground may be the biggest development of the past 10 years. Tulsky, once a complete outsider, now supervises scouts whose deep experience and feel for the game combine with stats to make key decisions. The eye test is essential, he says.
Tulsky, who interviewed for previous GM openings in Pittsburgh and Chicago and is surely being considered for Columbus' current opening, is happy in Carolina. And, no, the husband and father to a teenage son doesn't dwell on what life would look like in a lab coat. He's a hockey guy.
"I liked chemistry well enough. But I was doing hockey analysis for free in my spare time. I have not set up a chemistry lab in my garage," Tulsky said with a laugh.
John Matisz is theScore's senior NHL writer. Follow John on Twitter (@MatiszJohn) or contact him via email ([email protected]).